
Archaeology
The archaeology of the Kent, Sussex and Surrey High Weald tells us a lot about past use of the landscape.
In particular, the area’s ancient woodlands hold many secrets – they have seen less change compared to agricultural land and the archaeological features within them are often well-preserved and still waiting to be discovered.
Many people think of archaeological features as rare or something only unearthed by digging deep into the ground. But in the High Weald’s woods, archaeological features are everywhere, preserved on the surface due to the relatively undisturbed ground.
Archaeological features left from the Wealden Iron Industry
Evidence of the early iron industry from pre-Roman, Romano-British, Anglo-Saxon and the Early Medieval periods has been found in the High Weald.
When out and about in the High Weald you may discover the following features:
Iron bloomery slag
Bloomery slag was a waste product of iron furnaces from pre-Roman times until the Middle Ages. The slag trickled down either the inside or outside the furnace. The direction of the drips indicates the downward direction.
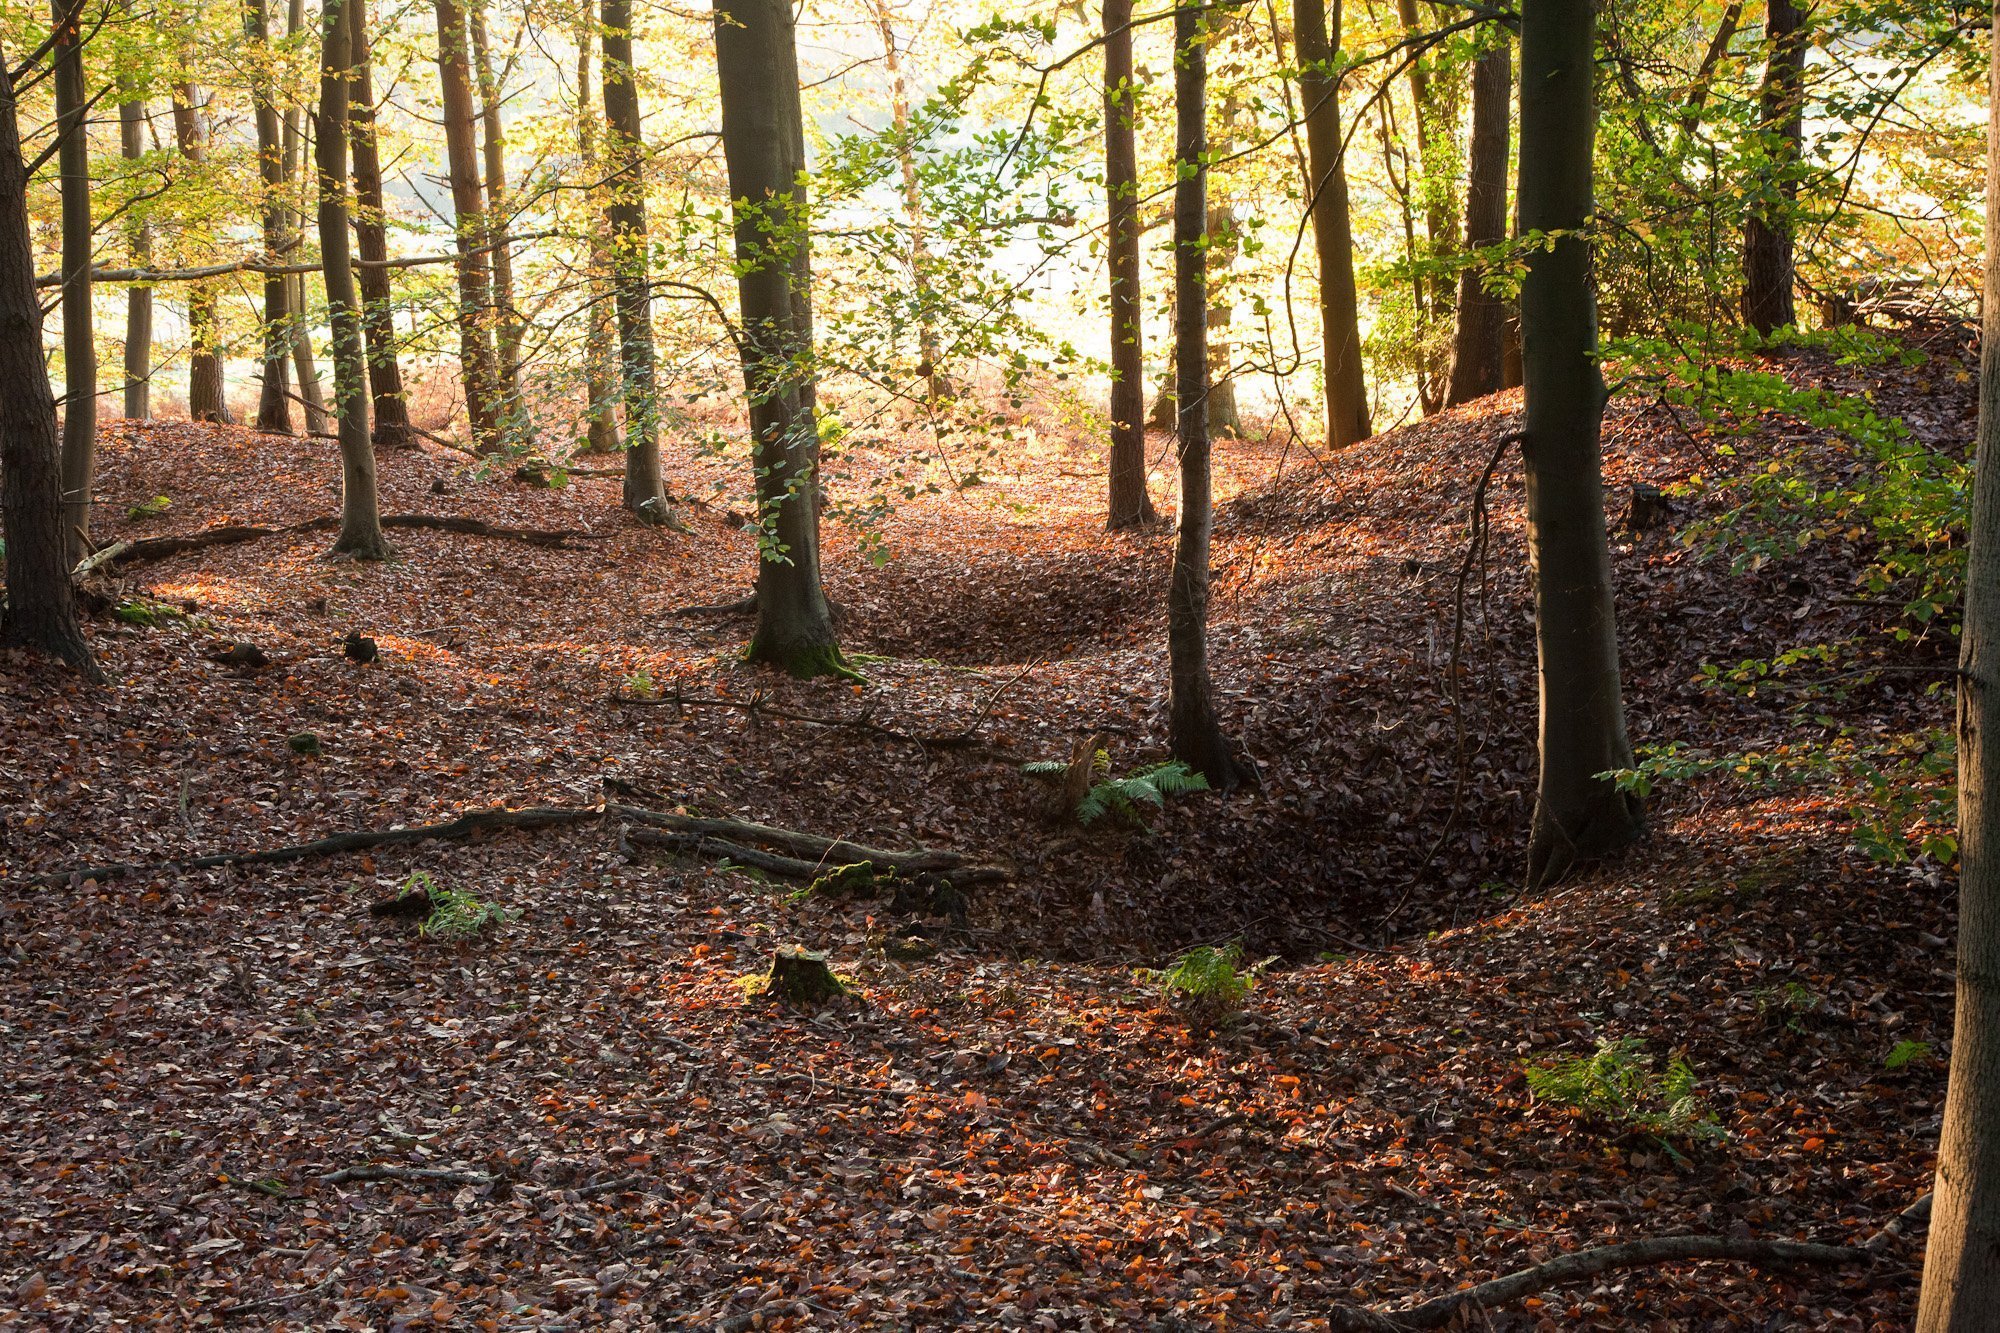
Minepits
Visible as small craters (approx. 2 to 4m across) which may fill with water in the winter and dry out in the summer. They were often dug in the area’s steep-sided gills where the natural erosion made it easier to prospect for iron ore deposits. Over time the pits have filled with compacted debris. Place names, such as ‘Minepit Wood’, offer clues to their location.if you find a mine-pit you can assume that there is probably an iron-making site nearby as miners would have kept movement of ore to a minimum.
Charcoal Heaths
Visible as levelled ground of 4-5 metres in width. Charcoal was critical to the production of iron. Coppiced wood (mainly oak, alder and hornbeam) was used to make the charcoal in round ‘clamps’ of 4-5 metres which were often constructed on levelled ground. The presence of nearly black soil and small pieces of charcoal can confirm past use.
Watch our video: Identifying charcoal hearths >>
Ponds with dams or bays, overflow channels, mill races, leats and wheel pits
The introduction of water-power for iron production from the 15th century added many new features to the landscape. These included large ponds with dams or bays, overflow channels, mill races, leats and wheel pits. You can see evidence of hammer ponds and pond bays in the landscape today. These are often marked on modern maps, but many remain unrecorded, hidden in gills and woodland.
Archaeology features left from other activities in woods
Woodland can hide archaeology from earlier times. Evidence of past land use includes old field boundaries, lynchets and ridges and furrows.
These are clues that woodlands in the High Weald have come and gone as economic fortunes have changed.
Banks in woodlands
Earthworks running through woodland can represent:
- administrative boundaries
- field boundaries
- parish or estate boundaries
These earthworks are usually banks and ditches, sometimes substantial in nature. These can often be identified on estate or historical ordnance survey maps.
The enclosure of woodland areas for arable or pasture may also be indicated by banks and ditches, possibly also marked by overgrown hedges. Abandoned fields are likely to have been colonised by scrub or secondary woodland.
Watch our video: Identifying wood banks
Lynchets
Lynchets are formed from the movement and build-up of soil after ploughing on sloping land and may be very shallow and difficult to identify with the colonisation of secondary woodland when fields have been abandoned.
Ridges and furrows
Ridge and furrow earthworks were created by the repeated ploughing of narrow strips of land. Medieval practices created curved and wide ridges and furrows; later practices created straighter and narrower ridges.
Routeways
Routeways crossing woodland may not be bounded by banks and ditches. Heavily used routes which may have become worn to a level below that of the surrounding land are called hollow ways and are more likely to exist on sloping ground.
Mounds and depressions
Mounds and depressions form a very general category of archaeological earthworks and may indicate settlement, water features, quarrying and other industry. Map and historical research together with place names may give some indication of the type of activity.

Get involved
There are still questions to be answered about the human use of the High Weald.
Find out more about archaeological surveys or historical research.
Further information
The Wealden Iron Research Group have undertaken detailed studies of many sites and have an online database of known iron working sites from all periods.
“Cab Cards” have been designed to help woodland workers identify and conserve important archaeological features they might encounter.